
The 4% Withdrawal Rule meets Longevity Risk
January 1, 2026
The 4% rule has held up better than it had any right to. But lower expected returns and longer retirements mean it’s worth stress-testing
Key takeaways
- 14% remains a solid baseline. Across most historical retirement start years, a 30-year, inflation-indexed withdrawal plan would have held up.
- 2But forward returns may be lower. Lower expected equity returns and lower bond yields reduce the margin for error, which is why some research houses now suggest starting below 4%.
- 3The 30-year horizon is a convenience. It fits a traditional retiree; it fits early retirees and long-lived households poorly.
- 4A better question is “solvent while alive.” Our mortality-adjusted SWR reframes success as staying solvent with a chosen confidence level, given longevity assumptions.
In 1994, William Bengen published what became known as the 4% rule. Using historical U.S. market data, he tested rolling historical retirement windows with a 50/50 stock-bond portfolio and a 30-year horizon. The policy is: withdraw 4% of the initial portfolio in year one, then increase that amount with inflation each year. In his tests, 4% emerged as a conservative starting point to survive even the worst historical 30-year retirement start dates in the sample.
And did the rule stand the test of history? We back-tested using Shiller's market data[1], with 50/50 stock-bond split. For each starting year, we run the next 30 years of returns/inflation and solve for the maximum initial withdrawal rate that keeps the portfolio from hitting zero within the 30 years. The result is the safe withdrawal rate, or SWR, defined as the highest first‑year withdrawal (as a % of the initial portfolio) that, when increased with inflation each year, would have kept the portfolio from hitting zero over the next 30 years.
The results can be seen as the following:
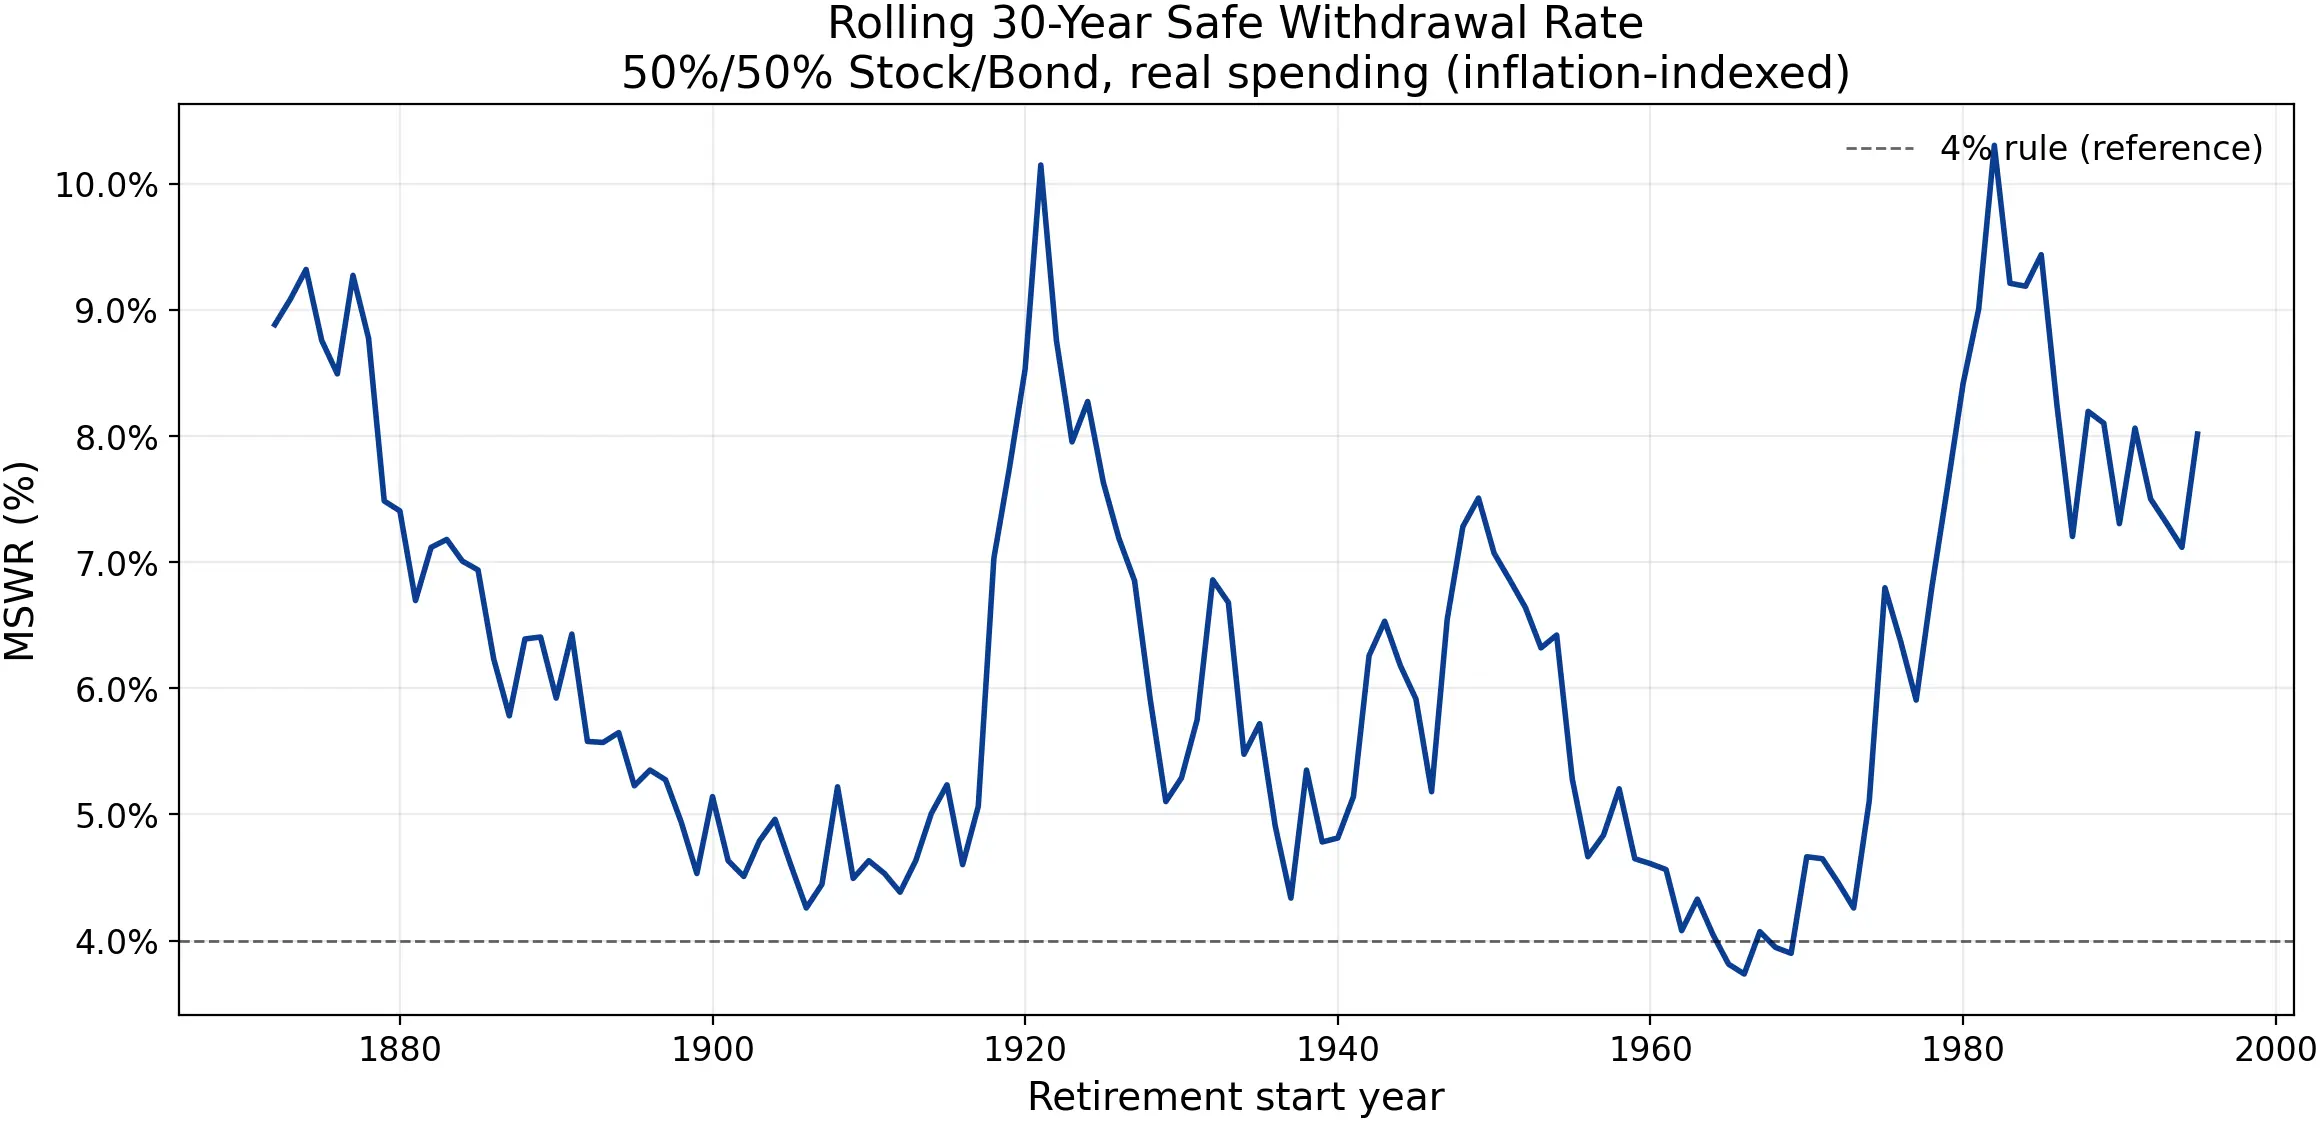
- Start year = the calendar year you begin retirement (i.e., the first year you start withdrawing from the portfolio).
- Line = the maximum sustainable initial withdrawal rate for that start year.
- Dashed line = classic 4% rule baseline.
Generally, the SWR calculated is above 4%, except a handful of mid-to-late 1960s start years (1965, 1966, and 1969). These years were notorious for high-inflation and weak real returns that persisted for much of the 1970s. For these worst years, Bengen has argued that the retiree would still be able to sustain their portfolio for 30 years just slightly above 4% withdrawal rates. Our estimates differ slightly because we use Shiller’s long-term Treasury rate series to construct a bond-return proxy, whereas Bengen’s original analysis used intermediate-term Treasuries. Nonetheless, the point still stands: based on historical back-tests, 4% is a solid withdrawal policy, and even including the years after his study is published, the safe withdrawal rate is generally above 4%.
But 4% withdrawal rate seems to be renewed scrutiny. MorningStar[2] has recently downgraded the safe withdrawal rate to 3.7% due to concern on high equity valuation and lower bond yields.
So while 4% withdrawal rule is a good heuristics, it is not a law of nature. Next, we will explore the few main shortcomings of the 4% withdrawal rules.
Common Criticisms of 4% withdrawal rules
One of the common criticisms of 4% withdrawal rule is that the percentage derived is based on historical back-tests. It's true that the 4% withdrawal rate seems to withstand the test of time so far, but that doesn't mean that the return that we have seen so far will repeat. Forward-looking capital market assumptions from several large research houses currently imply that U.S. equities' expected 10-year returns are below their long-run historical averages. For example:
-
Vanguard has recently described a "muted" outlook for U.S. stocks, citing model forecast of 3.5%~5.5% annualized equity return for the next 10 years[3].
-
BlackRock's published capital market assumptions put U.S. large-cap equity expected returns around ~5.2% annualized over 10 years[4].
Here is the sensitivity analysis of how the constant real returns affect the safe withdrawal rate over the 30-year horizon (without volatility of the returns as simplified sensitivity check that isolates the effect of the returns):

We can observe that the safe withdrawal rate is rather sensitive to the real returns.
Another common criticism of the withdrawal policy is that it is only planning for the horizon of 30 years. This is useful for people who are retiring around 65 and planning to age 95, but this is a poor fit for people who have different planning horizon:
- Early retirees, e.g. FIRE (Financial Independence and Retire Early) movement);
- People reassessing their finances mid-retirement.
- Household who needs to plan for couple instead of one person.
- People who have different expectation on their longevity risks, due to family history, health etc.
Therefore, the sensible move is to stress-test the rules.
Mortality-adjusted Safe Withdrawal Rate
To help us understand how the returns and variable planning horizon affect the withdrawal rates, we're introducing mortality-adjusted safe withdrawal rate calculator, where this is defined as "maximum sustainable withdrawal rate such that the retiree remains alive and solvent with at least 95% probability of longevity, given chosen mortality table and mortality-improvement assumption".
This allow us to input our current age and the planning horizon would be adapted automatically. We can also revise mortality assumptions to reflect our own view of our mortality risks.
To calculate this, we run the normal SWR back-test for each starting year, and then overlay a survival curve.
Here again, our assumptions use:
- Shiller's market returns
- 50/50 stock-bond split
- Social security 2022 life table (for 2025 trustee report)[5]
- Given that our planning horizon is much longer than the 30-year planning horizon, we're also using a circular rolling window for market return (i.e. if the projection year is over 2025, it starts over from year 1872 again.
You can tweak:
- Planning horizon by updating current age and mortality assumptions such as mortality factor and annual mortality improvement (see our blog post here).
- Historical returns by updating "return adjustment" (flat adjustment to all the returns).
Other real-world variables not modeled
Beyond returns and horizon, several factors can materially affect a withdrawal plan. Classic withdrawal-rate rules of thumb and most historical SWR back-tests typically simplify these assumptions, and so does this calculator. Among these are:
Tax & Fees
- Taxes are not modeled. Withdrawals and portfolio balances are shown pre-tax. In practice, after-tax spending depends on account types (taxable/Roth), tax brackets, and withdrawal sequencing.
- Fees are not modeled. Fund expenses/fees reduce net returns but are not considered here. Raw equity/bond returns are used.
Fixed spending
- Spending is assumed to be fixed in real terms (inflation‑adjusted). In reality, retirement spending often follows the so‑called “spending smile”: higher spending in the early “go‑go” years, lower spending in the mid “slow‑go” years, and then rising again later as healthcare and support costs increase[6].
- Real retirees are slightly more flexible to adjust spending depending on the market, health or lifestyle, and this flexibility can improve sustainability.
Conclusion
The 4% rule remains a solid baseline: across most historical start years, it would have supported a 30-year, inflation-indexed withdrawal plan. But it is not invincible. If future returns are lower, or if the retirement horizon is meaningfully shorter or longer than 30 years, then you would need a different initial withdrawal rate. That is the purpose of the calculator above: to illustrate how different returns and planning horizon affect the safe initial withdrawal rate.
Sources
- MorningstarMorningstar’s Retirement Income Research: Reevaluating the 4% Withdrawal RuleRetrieved January 1, 2026. https://www.morningstar.com/retirement/morningstars-retirement-income-research-reevaluating-4-withdrawal-rule
- VanguardVanguard Capital Markets Model® forecastsRetrieved January 1, 2026. https://corporate.vanguard.com/content/corporatesite/us/en/corp/vemo/vemo-return-forecasts.html
- BlackRock Investment InstituteBlackRock capital market assumptions (Excel)Retrieved January 1, 2026. https://www.blackrock.com/blk-inst-c-assets/images/tools/blackrock-investment-institute/cma/blackrock-capital-market-assumptions.xlsx
- Social Security AdministrationPeriod Life Table, 2022 (Table 4C6)2022. Retrieved January 1, 2026. https://www.ssa.gov/oact/STATS/table4c6.html
- Retirement ResearcherWhat Is The 'Retirement Spending Smile'?Retrieved January 1, 2026. https://retirementresearcher.com/retirement-spending-smile/
About the author
Roen is a Fellow of the Society of Actuaries (FSA) and a Chartered Enterprise Risk Actuary (CERA) working in life insurance. His work focuses on Solvency II, capital management, and asset–liability management, with deep experience in financial and stochastic modelling. On this site, he uses the same actuarial tools applied in insurers to help individuals think more rigorously about retirement and long-term financial risk.