
Longevity Risk in Financial and Retirement Planning
December 14, 2025
Retirement planning has a longevity problem: most people treat life expectancy as a finish line rather than probability distribution. Better planning means thinking in percentiles, updating for own health and future medical advancements, and remembering that couples face a longer tail than individuals.
When Otto von Bismarck introduced the world's first state pension in 1889, he set the pensionable age at 70. It was a political masterstroke—a promise to care for the working class that the Prussian treasury could comfortably afford. At the time, only a fraction of workers were expected to reach that age, and those who did would collect for just a few years.
Today, that biological ceiling has been shattered.
Thanks to a century of antibiotics, statins, and sanitation, the ranks of the "oldest old" are swelling. There were 2,300 centenarians in the United States in 1950. Today there are over 100,000.[1] Globally, the Pew projects the centenarian population will grow from 722,000 in 2024 to nearly 4 million by mid-century.[1] In Britain, demographers estimate that one-third of babies born in 2016 will live to see their hundredth birthday.[2]
This is a triumph for biology and chemistry. It is also a crisis for the spreadsheet.
The Point Estimate Problem
In financial planning, it is common to set a target end-age for retirement: 85, 90, perhaps 95 for the cautious. The number feels responsibly chosen—a sensible buffer against the risk of living "too long."
But consider what this approach actually implies.
The most intuitive approach is to take median life expectancy (say 84) and plan to that age. But this means, by definition, a 50% probability of outliving your money. In structural engineering, a 50% failure rate would be criminal negligence.
Financial planners recognise this, of course. They extend the target to 90 or 95, adding a margin of safety. But the fundamental error persists: they are still selecting a single number where a probability distribution belongs. Is 95 pessimistic, realistic, or optimistic? The answer depends entirely on who you are, how old you are today, and what you're willing to assume about medical progress.
A target age is not a plan. It is a guess with a veneer of precision.
The Table You Should Actually Use
Return, for a moment, to Bismarck's Prussia.
In the 1880s, the average life expectancy was 45. A pensionable age of 70, then, would appear to be a cruel joke—a promise designed to be broken. And yet, 30% of workers who reached adulthood lived to collect.[3]
The discrepancy reveals a statistical trap that persists today. Life expectancy at birth is dragged down by infant deaths, workplace accidents, drug overdoses. These tragedies are included in the average. They are also, if you are old enough to be reading a retirement planning blog, possibly irrelevant to you: you have already 'survived' them.
The relevant question is not "how long does a newborn live?" but rather "given that I have reached age X, how much longer can I expect to live?" This is conditional life expectancy. The numbers are consistently, sometimes dramatically, higher than the figures most people carry in their heads.
The following tables show conditional life expectancy—the projected age at death given your current age. The median column shows the age by which half will have died; the 90th percentile shows the age that 10% of survivors are expected to exceed.
United States (2022 Period Life Table for 2025 Trustees Report)
| Current Age | Median (Male) | 90th (Male) | Median (Female) | 90th (Female) |
|---|---|---|---|---|
| 55 | 82 | 94 | 86 | 96 |
| 65 | 84 | 94 | 86 | 96 |
| 75 | 86 | 95 | 88 | 97 |
United Kingdom (ONS 2022-2024)
| Current Age | Median (Male) | 90th (Male) | Median (Female) | 90th (Female) |
|---|---|---|---|---|
| 55 | 84 | 94 | 87 | 97 |
| 65 | 85 | 95 | 88 | 97 |
| 75 | 87 | 95 | 89 | 97 |
Singapore (Department of Statistics 2024 (Preliminary))
| Current Age | Median (Male) | 90th (Male) | Median (Female) | 90th (Female) |
|---|---|---|---|---|
| 55 | 85 | 95 | 89 | 98 |
| 65 | 86 | 96 | 89 | 98 |
| 75 | 87 | 96 | 90 | 98 |
The takeaway is clear: if you have made it to a certain age, you are no longer in the general population. You are now in a smaller, hardier cohort, and your planning horizon should reflect that.
Mortality Improvement
But reading the mortality table is not enough. The table itself is backward-looking.
Mortality tables are constructed from historical data, often spanning a decade or more. Therefore by definition they are a snapshot of how people died during a particular window of time. The problem is that the past doesn't necessarily reflect the future.
Living standards, technologies, access to nutrition and clean water (more often than not) improve over time. Treatments that did not exist a decade ago become routine. Examples include statins, anticoagulants, minimally invasive surgery, GLP-1 agonists for cardiovascular risk, immunotherapies that convert certain cancers from death sentences into chronic conditions. By the time your cohort reaches old age, the mortality rates observed in today's tables may be outdated.
To correct for this phenomenon, we use "mortality improvement rate" to capture the effect of the time on mortality rates. Historically, mortality improvement has averaged roughly 1-2% per year across developed countries. This sounds modest, but the effect compounds if you consider longer horizon (say, 30 years).
But mortality improvement is not uniform across cohorts. Consider: the 80-year-olds in today's mortality tables were born in the 1940s. The 40-year-olds were born in the 1980s. These groups were raised in different environments, with different diets, different healthcare access, different habits. A generation that grew up with widespread smoking will age differently from one that did not. Therefore, in our practice we also apply cohort-adjusted mortality improvements if possible, and this could be higher or lower than the average 1-2% per year. In Canada and the United States, for instance, the opioid crisis has pushed mortality rates upward for certain age groups. Improvement is not guaranteed.
The Wealth Effect
In the insurance industry, one of the strongest predictors of mortality is the "face amount band": the size of the policy someone has purchased. Higher coverage correlates with longer life. The reasons are partly mechanical (stricter underwriting for larger policies screens for healthier applicants) but also structural. Wealthier individuals have better access to healthcare, nutrition, and safer environments. All these help them live longer than the average person.
The public health data confirms this pattern at scale.
In England, men in the most deprived areas live nearly 11 years fewer than those in the least deprived:
| IMD Decile | Males Life Expectancy | Males Healthy Life Expectancy | Females Life Expectancy | Females Healthy Life Expectancy |
|---|---|---|---|---|
| 1 (most deprived) | 72.58 | 51.13 | 77.66 | 50.54 |
| 5 | 79.09 | 62.61 | 83.00 | 63.05 |
| 10 (least deprived) | 82.98 | 70.09 | 86.08 | 70.16 |
The pattern holds in the United States, where the gap in life expectancy between the richest and poorest 1% exceeds 14 years for men and 10 years for women. The divergence is visible in the survival curves:
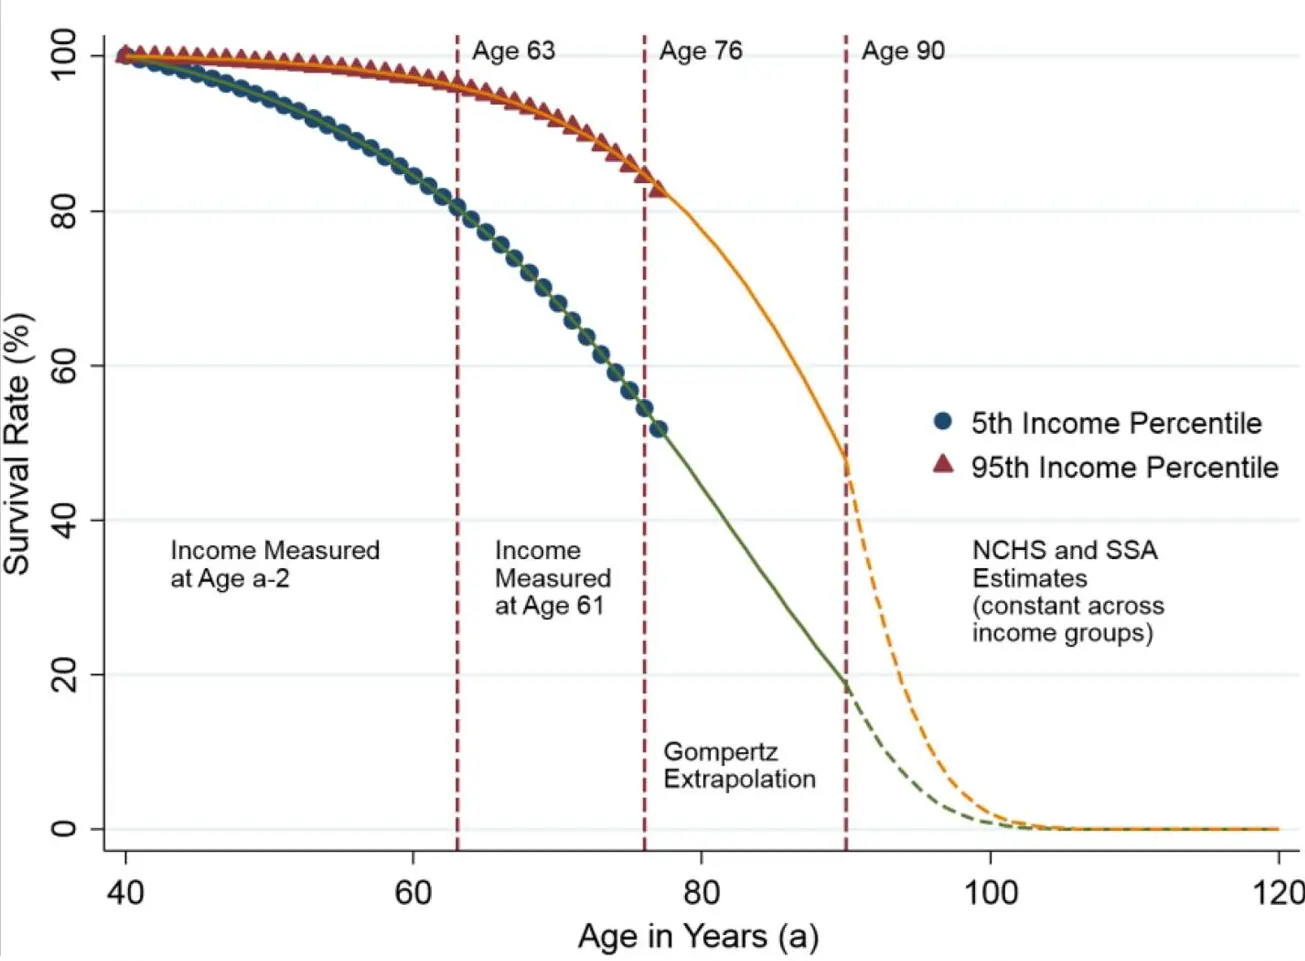
Implication? Reading a financial planning blog is itself a positive mortality indicator. You have assets worth protecting, and you worry about the long-term future. This correlates with good health and longevity. Population averages may understate your risk.
The Calculator
To illustrate the points above, we have built a simple interactive tool.
The Two-Life Problem
For couples, the mathematics shift.
Individual life expectancy becomes the wrong measure. The correct question is not "when will I die?" but "when will we both be gone?" After all, the probability that at least one partner survives to a given age is substantially higher than either individual's probability.
If both partners have a 25% chance of reaching 95, the probability that neither reaches 95 is 0.75 × 0.75 = 56%. The probability that at least one survives? 44%. The joint survival curve has a fatter tail than either individual curve.
Yet most couples plan as though they will exit together. They will not. One partner will outlive the other by years, sometimes a decade or more. The assets must stretch to the second death, not the first.
The surviving spouse faces financial change: one pension payment vanishes or reduces, and while some costs decline, others remain stubbornly fixed: property taxes, utilities, home maintenance. The surviving partner is older, most likely to face cognitive decline, and most in need of support, at precisely the moment the financial cushion thins.
Joint planning that ignores the surviving spouse is not conservative. It is incomplete.
Managing Longevity Risk
Retirement planning is a balancing act. Plan too aggressively—assume you will die at 85 when you will not—and you risk outliving your savings. Plan too conservatively—assume you will live to 100 when you will not—and you spend your healthy years pinching pennies and deferring holidays for a future that never arrives.
The question is not "when will I die?" but "how much longevity risk am I taking, and what is my fallback if I am wrong?" For some, the answer is an annuity that guarantees income for life or life insurance that provides for the surviving spouse. For others, it is maintaining flexibility and accepting some probability of adjustment. There is no universally correct answer—but there is a wrong way to approach the question, and that is to ignore the uncertainty altogether.
We built ActuaPlan to make longevity risk visible. Rather than picking a target age and hoping for the best, our models test portfolio outcomes across the full longevity distribution: the probability of reaching 85, 90, 95, and what each scenario means for your portfolio.
Longevity is not a number to be guessed. It is a risk to be seen clearly, and managed accordingly.
References
- Pew Research CenterUS centenarian population is projected to quadruple over the next 30 yearsJanuary 9, 2024. Retrieved December 2025. https://www.pewresearch.org/short-reads/2024/01/09/us-centenarian-population-is-projected-to-quadruple-over-the-next-30-years/
- Office for National StatisticsWhat are your chances of living to 100?January 14, 2016. Retrieved December 2025. https://www.ons.gov.uk/peoplepopulationandcommunity/birthsdeathsandmarriages/lifeexpectancies/articles/whatareyourchancesoflivingto100/2016-01-14
- Ballod, CarlAbsterbeordnung in den Landgemeinden und Gutsbezirken des Preußischen Staates 1876-801899. Tabelle IVb.
- Office for National StatisticsHealth state life expectancies by Index of Multiple Deprivation, England2020-2022. Retrieved December 2025. https://www.ons.gov.uk/peoplepopulationandcommunity/healthandsocialcare/healthinequalities/bulletins/healthstatelifeexpectanciesbyindexofmultipledeprivationimd/2020to2022
- JAMAThe Association Between Income and Life Expectancy in the United States, 2001-2014April 26, 2016. Retrieved December 2025. Chetty R, Stepner M, Abraham S, et al.. https://jamanetwork.com/journals/jama/fullarticle/2513561
About the author
Roen is a Fellow of the Society of Actuaries (FSA) and a Chartered Enterprise Risk Actuary (CERA) working in life insurance. His work focuses on Solvency II, capital management, and asset–liability management, with deep experience in financial and stochastic modelling. On this site, he uses the same actuarial tools applied in insurers to help individuals think more rigorously about retirement and long-term financial risk.